Solar Photovoltaics (PV) are the panels that convert sunlight into electricity. Solar Energy has experienced massive growth over the last decade. A reduction in the cost of solar panels and an improvement in their efficiency has led to an explosion in the number of rooftop and utility-scale PV systems being installed. But what are the solar energy growth statistics? Which countries are making the biggest contribution? We’ve used the latest data from the International Energy Agency, published in April 2022, to provide all the key data below.
Contents
Key Statistics (Editors Picks)
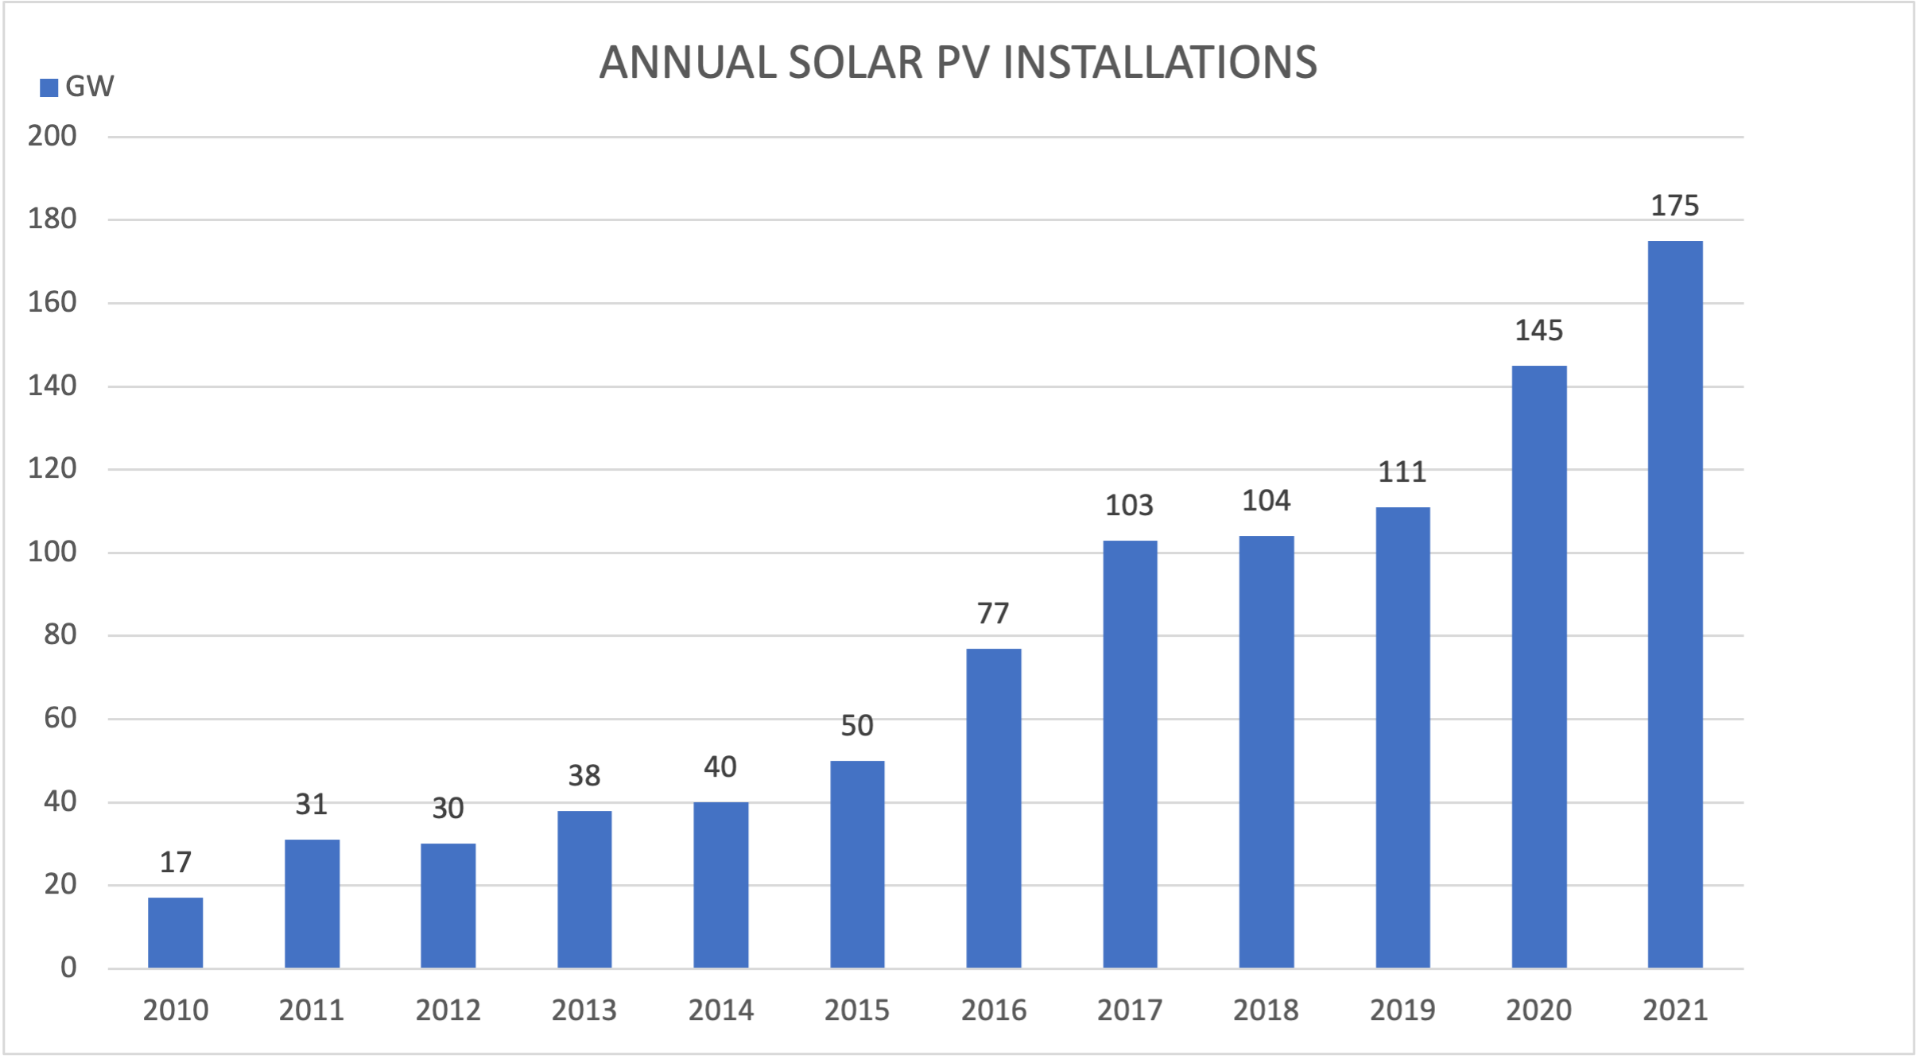
- Global data shows that annual installations of Solar PV have grown 929% from 2010 to 2021.
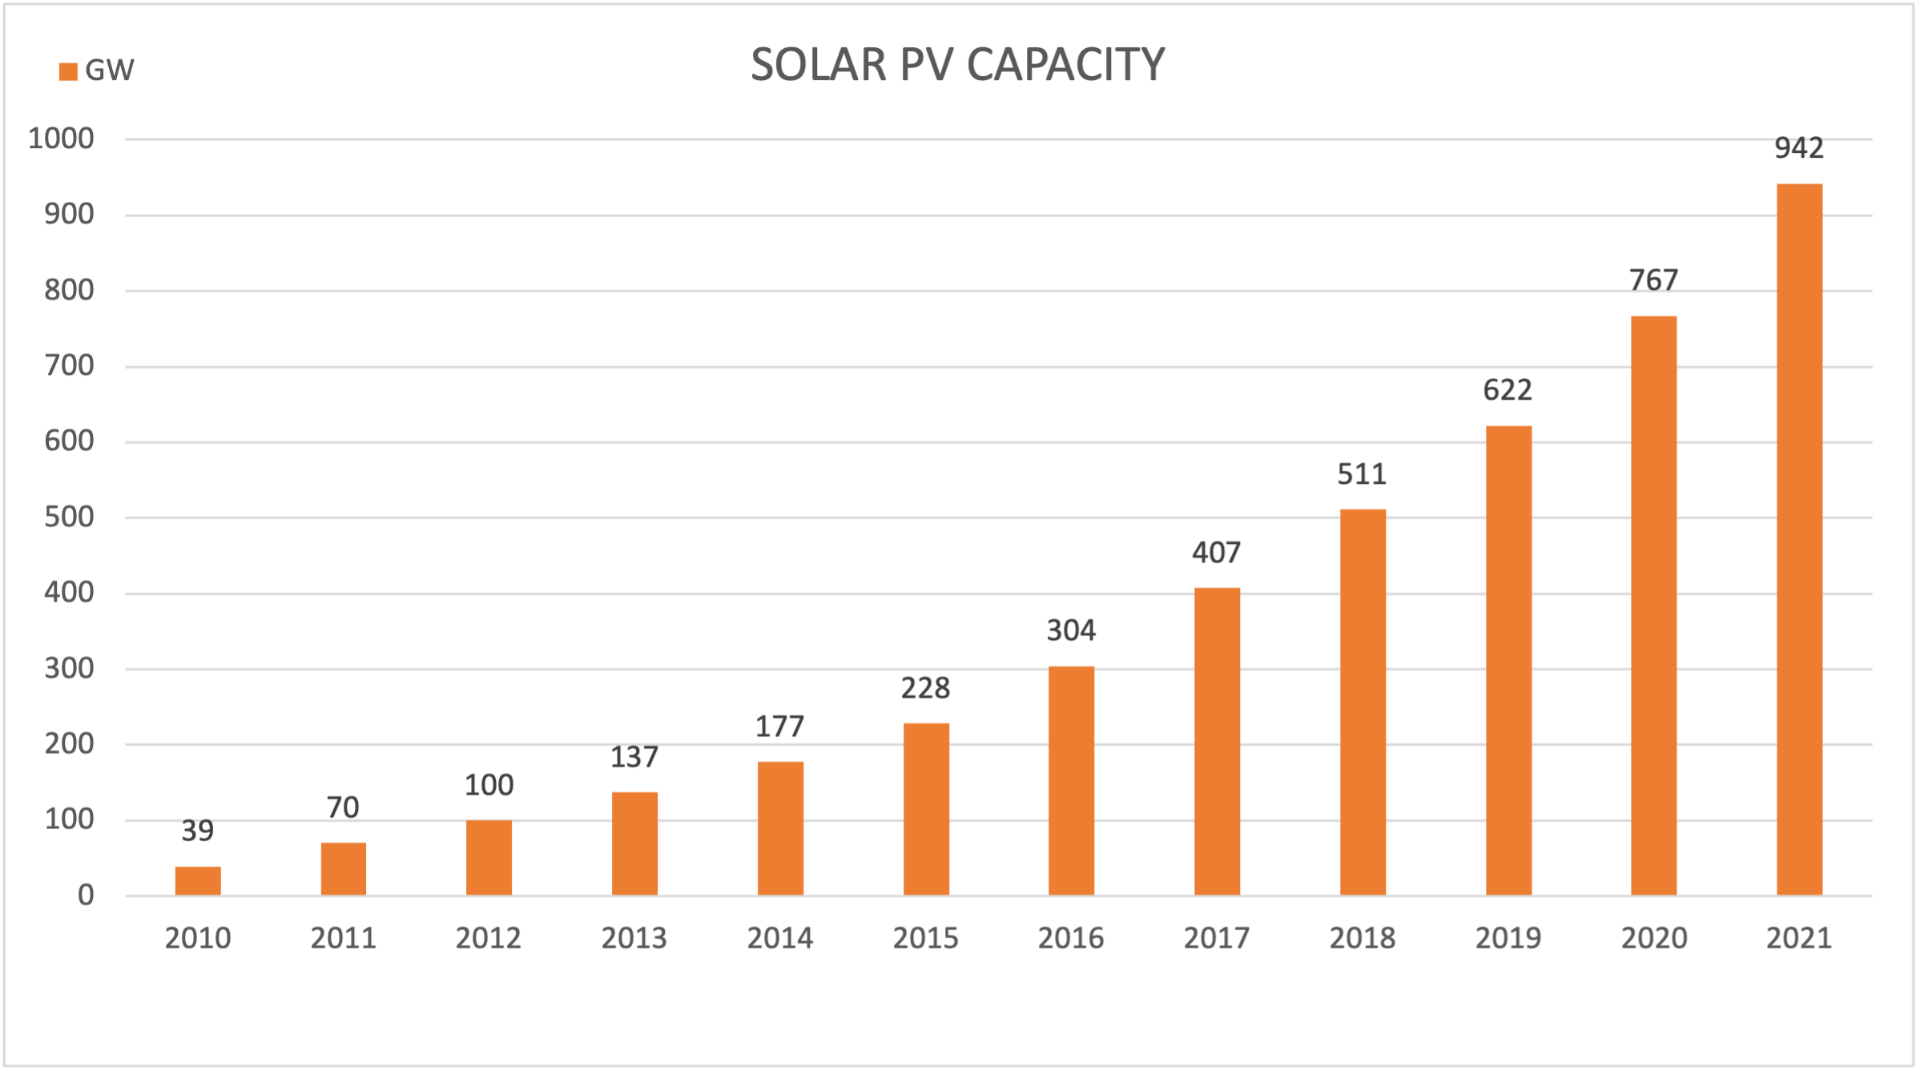
- The global capacity of Solar PV reached 942 GW at the end of 2021.
- 5% of the global electricity demand came from Solar PV in 2021.
- The electricity generated from Solar PV in 2021 meant that 1,100 Mt of CO2 were avoided.
The Growth of Solar Energy
WHAT IS THE GLOBAL GROWTH RATE OF SOLAR PV?
Global data shows that annual installations of Solar PV have grown by 929% from 2010 to 2021. 175 GW was installed globally in 2021 vs only 17 GW in 2010.
KEY STATISTICS:
- Global data shows that annual installations of Solar PV have grown 929% from 2010 to 2021.
- Only 17 GW of Solar PV was installed globally in 2010 vs 175 GW in 2021.
- In 2021 Solar PV installation was up 21% on the previous year.

Which countries installed the most Solar PV in 2021?
The countries that installed the most Solar PV in 2021 were China (55 GW), USA (27 GW) and India (13 GW).
| Country | Solar PV Installation in 2021 |
|---|---|
| China | 54.9 GW |
| USA | 26.9 GW |
| India | 13 GW |
| Japan | 6.5 GW |
| Brazil | 5.5 GW |
| Germany | 5.3 GW |
| Spain | 4.9 GW |
| Australia | 4.6 GW |
| Korea | 4.2 GW |
| France | 3.3 GW |
HOW MUCH SOLAR PV WAS INSTALLED IN THE UK IN 2021?
The UK installed 0.73 GW of Solar PV in 2021.
Solar PV Capacity
WHAT IS THE GLOBAL SOLAR PV CAPACITY?
The global capacity of Solar PV reached 942 GW at the end of 2021 - capacity stood at 767 GW at the end of 2020 and 175 GW was added in 2021.

Which countries have the most Solar PV installed?
At the end of 2021 the countries with the biggest installed capacity of Solar PV were China (308.5 GW), USA (123 GW) and Japan (78.2 GW).
| Country | Total Solar PV Capacity (2021) |
|---|---|
| China | 308.5 GW |
| USA | 123 GW |
| Japan | 78.2 GW |
| India | 60.4 GW |
| Germany | 59.2 GW |
| Australia | 25.4 GW |
| Italy | 22.6 GW |
| Korea | 21.5 GW |
| Spain | 18.5 GW |
| Vietnam | 17.4 GW |
WHAT’S THE UK SOLAR PV CAPACITY?
At the end of 2021 the UK had 14.6 GW of Solar PV capacity installed.
Solar Energy Production
WHAT PERCENTAGE OF GLOBAL ENERGY IS PRODUCED BY SOLAR PV?
5% of the global electricity demand came from Solar PV in 2021.
WHICH COUNTRIES PRODUCE THE MOST ENERGY FROM SOLAR PV?
The countries where Solar PV contributes the most to the national electricity demand are Australia (15.5%), Spain (14.2%) and Greece (13.6%).
There are only seven nations where PV generated electricity contributes more than 10% to national demand - Australia, Spain, Greece, Honduras, Netherlands, Chile and Netherlands.
| Country | Contribution of Solar PV to National Electricity Demand (2021) |
|---|---|
| Australia | 15.5% |
| Spain | 14.2% |
| Greece | 13.6% |
| Honduras | 12.9% |
| Netherlands | 11.8% |
| Chile | 10.9% |
| Germany | 10.9% |
| Japan | 9.4% |
| Italy | 9.3% |
| Israel | 8.9% |
How much of the UK’s energy is produced by Solar PV?
4% of the UK’s energy is generated from Solar PV.
Impact of Solar PV On Climate Change
HOW MUCH CO2 IS SAVED WITH SOLAR PV?
The electricity generated from Solar PV in 2021 meant that 1,100 Mt of CO2 were avoided. However, CO2 emissions from energy production methods were still in the region of 33 Gt.
Conclusion
Statistics show that despite massive growth in annual installations and the subsequent growth in global capacity, only 5% of the worldwide energy demand was met by Solar PV. Exponential growth needs to continue if Solar PV is to make a more significant contribution to reducing CO2 from energy production.
Sources:
Snapshot of Global PV Markets 2022, International Energy Agency, April 2022
https://iea-pvps.org/wp-content/uploads/2022/0/IEA_PVPS_Snapshot_2022-vF.pdf
Review of solar PV capacity, Department for Business, Energy and Industrial Strategy, March 2022
https://assets.publishing.service.gov.uk/government/uploads/system/uploads/attachment_data/file/1064817/Review_of_solar_PV_capacity_publications.pdf
https://www.solarpowerportal.co.uk/blogs/uk_installed_730mw_of_solar_pv_in _2021
